• Data Analysis
  • Design
  • Writing
  • About
  • Contact
Menu

Liz Olson

Data analysis, policy research, deslgn
  • Data Analysis
  • Design
  • Writing
  • About
  • Contact

Migrant Deaths in Mexico, Northern Central America, and the U.S. Border

May 11, 2016

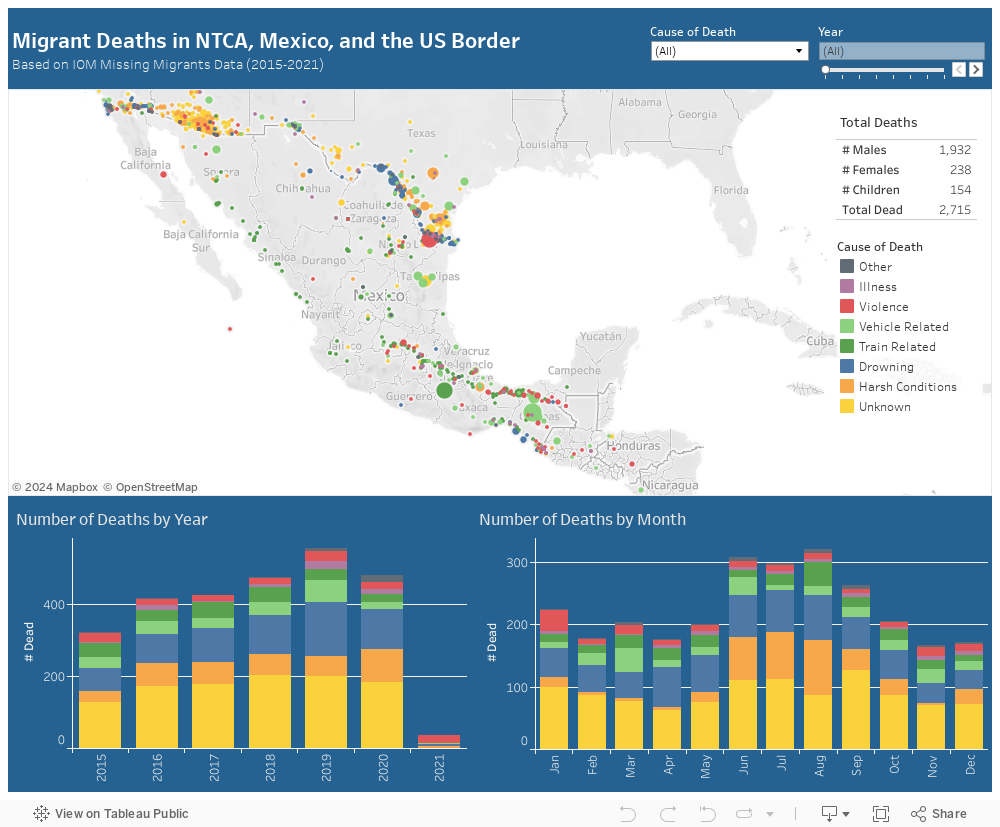
This interactive map, created using IOM Missing Migrants data, demonstrates trends in migrant deaths en route from Central America to the United States border. This map demonstrates that the summer months of June and July are most deadly. The map highlights the deadliest areas of the journey, according to Missing Migrant reports. Specifically, there are a number of vehicle-related fatalities along the train tracks in southern Mexico, as well as along the western coast. Along the U.S. border, there are a large number of deaths due to exposure in Arizona, and deaths due to drowning along the Rio Grande in Texas. When interpreting this data, it is important to keep in mind the limitations of the Missing Migrants dataset, namely that migrant deaths not reported by the media or recorded by officials due to their remote location or other circumstances may be systematically excluded from the data.

In dashboard Tags migration
← Mapping the Dynamics of Humanitarian Assistance in Mexico

Latest Posts

Featured
Aug 16, 2022
A Spatial Exploration of Music Consumption Through the Lens of Socio-Political Power
Aug 16, 2022
Aug 16, 2022
Aug 16, 2022
United Nations Migration (IOM) - Lake Chad Basin Stability Index Report
Aug 16, 2022
Aug 16, 2022
May 2, 2022
From 4-Chan to the Capitol: A Text-As-Data Analysis of Q-Anon Posts
May 2, 2022
May 2, 2022
Sep 25, 2016
2021 Reading Analysis
Sep 25, 2016
Sep 25, 2016
Jul 13, 2016
Mapping the Dynamics of Humanitarian Assistance in Mexico
Jul 13, 2016
Jul 13, 2016
May 11, 2016
Migrant Deaths in Mexico, Northern Central America, and the U.S. Border
May 11, 2016
May 11, 2016